Intro
In this article, we’ll walk through my process for revealing SourceGuardian-protected PHP bytecode. We’ll get into some PHP 5.4 internals since this is the version Nagios XI was built on. Also we’ll perform some static and dynamic analysis of the SourceGuardian loader extension. Finally, the end result is a modified version of the Vulcan Logic Dumper (VLD). Many thanks to Derick Rethans and all who contributed to VLD!
Here is a brief outline of the topics to be covered:
- PHP Bytecode
- The SourceGuardian Loader
- Vulcan Logic Dumper
- Hooking zend_execute
- Challenges encountered
- Opcode Handlers
- Analyzing Custom Handlers
- My Solution
Below is a protected file. The goal is to decode this into something we can analyze.

Before we move onto analysis, let’s see a description of the SourceGuardian product. Their website says, “Our PHP encoder protects your PHP code by compiling the PHP source code into a binary bytecode format, which is then supplemented with an encryption layer.“
PHP Bytecode
Similar to other interpreted programming languages, PHP source code is compiled into bytecode. For example, the following PHP code:
<?php
    echo "hello world";
?>
Would be compiled into the below. Although, the below graphic is a visual representation of a zend_op_array. The Vulcan Logic Dumper (VLD) can be used to dump bytecode in this format. The output shows individual opcodes and their associated fields.

Here is another short example:
<?php
for($i=0; $i<3; $i++){
    echo "hi";
}
?>
Would be compiled into:
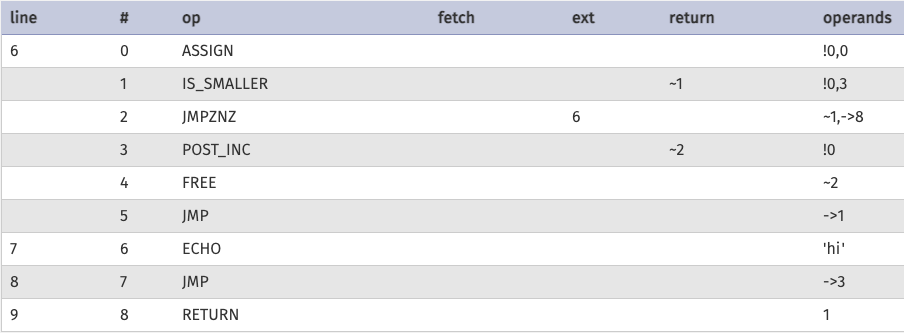
As we go, keep in mind that source code is compiled into operations. I may call them instructions as well.
sg_load()
From now on, I’ll refer to SourceGuardian-protected files simply as “encoded” files, and SourceGuardian will be abbreviated as “SG”. When an encoded file is launched by the PHP interpreter, it is decoded by an SG “loader,” which is implemented as a PHP extension.
Given that the encoder compiles the source code and encrypts the bytecode, the loader must decrypt and execute the compiled bytecode. The loader implements a key function called sg_load(), which does this. In all encoded files, you’ll find a call to this function at the end of the file.

My goal was to simply dump the original bytecode instructions with VLD.
VLD
Let’s check out how VLD works. We’ll start with an unencoded “hello world” example:
<?php
    echo "Hello world!\n";
?>
If we were to dump this with VLD, it would show:

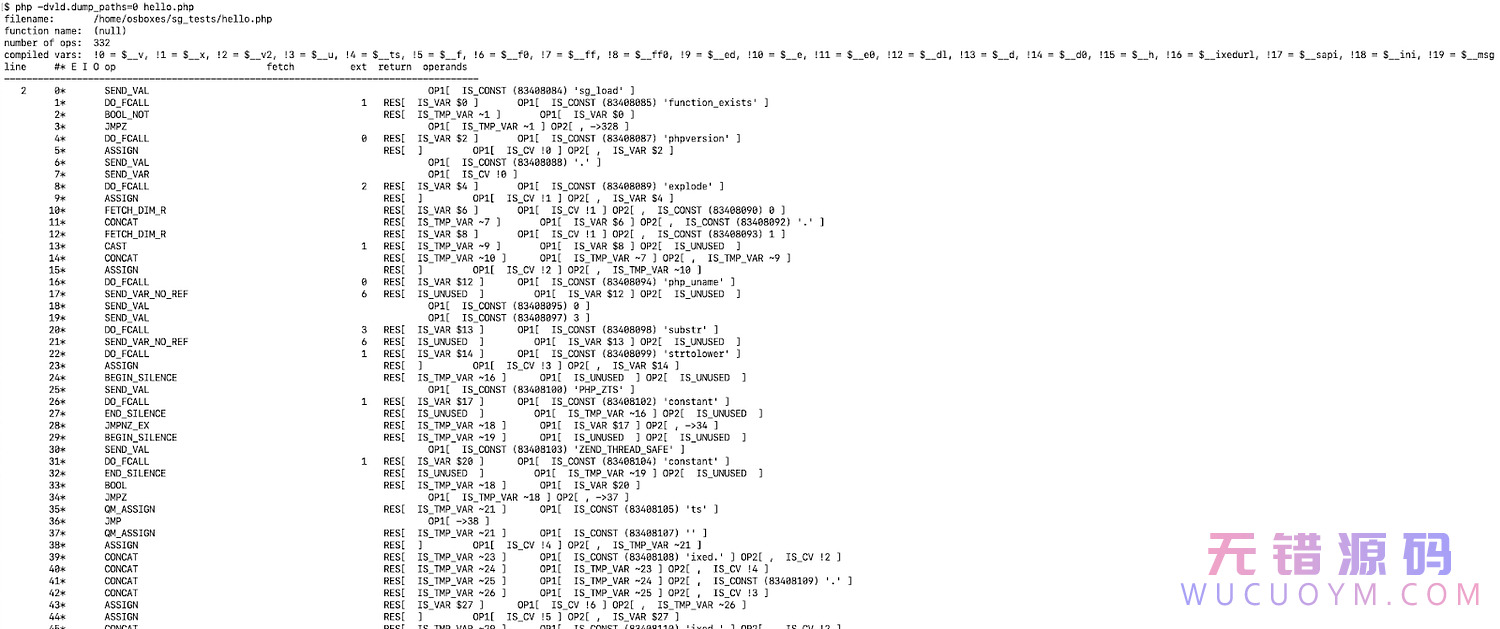
The catch is that VLD hooks zend_compile_file(), and this output is coming from there. After zend_compile_file() is called to compile the source code into a zend_op_array, the op array is dumped using the vld_dump_oparray() function. This is all handled in vld_compile_file().

If we were to run VLD as-is against an encoded file, the results would not give us what we want. It was not designed to decode protected files. Instead, we would see opcodes for the SG wrapper code along with a call to sg_load(). The input to sg_load(), containing encrypted bytecode, would not be dumped because it does not need to be compiled.
Note: The VLD project description explicitly states it “can not be used to un-encode PHP code that has been encoded with any encoder.”
Dumping Opcodes in zend_execute()
An encoded file must be executed, right? The bytecode is decrypted then executed by zend_execute(). This is where I started to get my hands dirty.
VLD already has a hook built in for zend_execute(), so if we modify VLD to dump the zend_op_array passed to zend_execute(), we can see the opcodes being executed. Note that VLD renames the function to vld_execute().
static void vld_execute(zend_op_array *op_array TSRMLS_DC)
#endif
{
        php_printf("\nexecute()\n");
        vld_dump_oparray (op_array TSRMLS_CC);
        old_execute(op_array);
}
Modified Vld.c
In order to have a controlled test environment, I created some sample files and encoded them. I started with hello.php from before.
Here is the result of running the modified VLD against hello.php.

It clearly executed just fine. But why are there no opcodes shown?
Empty Opcode Dump
I needed to start debugging to see what was going on under the hood. First off, a zend_op_array is passed as an argument here.
static void vld_execute(zend_op_array *op_array TSRMLS_DC)
Let’s see what the structure looks like:

…
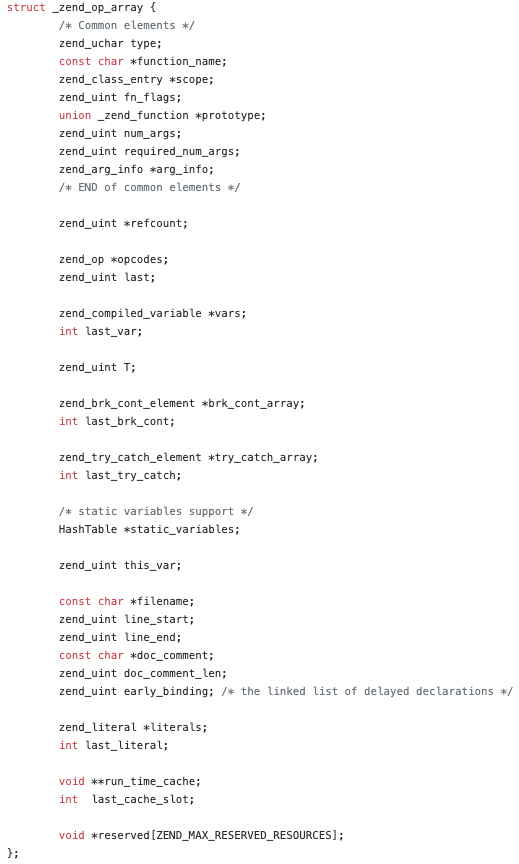
Now, what does vld_dump_oparray() do with it? This is defined in srm_oparray.c. Quite a bit happens, in fact. It analyzes the branches, formats the output and dumps the opcodes in the array. There is a loop that iterates over each zend_op in the opcodes member and calls vld_dump_op().

Here is the zend_op structure.

…
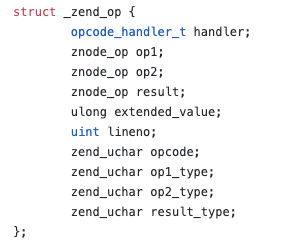
Okay, so what does vld_dump_op() do? Essentially, it inspects the specified zend_op and outputs the relevant pieces. One unusual thing is this: the lineno is always 0.
In comes the debugger!
All debugging was performed in the GNU Debugger (GDB). I set a breakpoint on execute() so we can inspect the op_array and opcodes contained within. I’ve left out the SG wrapper code dump and excessive debugger output. Something to note is that execute() must be hit twice because the first call to execute is for the wrapper code, and the second call executes the bytecode we’re after.
$ gdb php
Reading symbols from php...
(gdb) b execute
Breakpoint 1 at 0x36f760: file php-src/Zend/zend_vm_execute.h, line 343.
(gdb) r -dvld.dump_paths=0 -dvld.execute=0 hello.php
Starting program: /usr/local/bin/php -dvld.dump_paths=0 -dvld.execute=0 hello.php
[Thread debugging using libthread_db enabled]
Using host libthread_db library "/lib/x86_64-linux-gnu/libthread_db.so.1".
. . . <snip> . . .Breakpoint 1, execute (op_array=0x7ffff5b7e918) at php-src/Zend/zend_vm_execute.h:343
343 {
(gdb) c
Continuing.execute()
filename:       hello.php
function name:  (null)
number of ops:  3
compiled vars:  none
line     #* E I O op                           fetch          ext  return  operands
--------------------------------------------------------------------
Breakpoint 1, execute (op_array=0x7ffff5b85340) at php-src/Zend/zend_vm_execute.h:343
343 {
(gdb) p op_array
$1 = (zend_op_array *) 0x7ffff5b85340
(gdb) p *op_array
$2 = {type = 2 '\002', function_name = 0x0, scope = 0x0, fn_flags = 134217728, prototype = 0x0, num_args = 0, required_num_args = 0, arg_info = 0x0, refcount = 0x7ffff5b805f8, opcodes = 0x7ffff5b7ea18, last = 3, vars = 0x0, last_var = 0, T = 0, brk_cont_array = 0x0,
  last_brk_cont = 0, try_catch_array = 0x0, last_try_catch = 0, static_variables = 0x0, this_var = 4294967295, filename = 0x7ffff5b7eab8 "hello.php", line_start = 0, line_end = 0, doc_comment = 0x0, doc_comment_len = 0, early_binding = 4294967295,
  literals = 0x7ffff5b85440, last_literal = 2, run_time_cache = 0x0, last_cache_slot = 0, reserved = {0x555555f4e450, 0x0, 0x0, 0x0}}
Take note of a few things here in the op_array. Last = 3, which makes sense, there are 3 operations. It’s also weird that line_start and line_end are both 0 though. Let’s look at the individual zend_op’s.
(gdb) p op_array->opcodes[0]
$4 = {handler = 0x7ffff4a09280, op1 = {constant = 4122471032, var = 4122471032, num = 4122471032, hash = 140737315859064, opline_num = 4122471032, jmp_addr = 0x7ffff5b7ea78, zv = 0x7ffff5b7ea78, literal = 0x7ffff5b7ea78, ptr = 0x7ffff5b7ea78}, op2 = {constant = 0,
    var = 0, num = 0, hash = 0, opline_num = 0, jmp_addr = 0x0, zv = 0x0, literal = 0x0, ptr = 0x0}, result = {constant = 0, var = 0, num = 0, hash = 0, opline_num = 0, jmp_addr = 0x0, zv = 0x0, literal = 0x0, ptr = 0x0}, extended_value = 0, lineno = 0, opcode = 42 '*',
  op1_type = 0 '\000', op2_type = 0 '\000', result_type = 0 '\000'}(gdb) p op_array->opcodes[1]
$5 = {handler = 0x5555558dfaa0 <ZEND_ECHO_SPEC_CONST_HANDLER>, op1 = {constant = 4122498112, var = 4122498112, num = 4122498112, hash = 140737315886144, opline_num = 4122498112, jmp_addr = 0x7ffff5b85440, zv = 0x7ffff5b85440, literal = 0x7ffff5b85440,
    ptr = 0x7ffff5b85440}, op2 = {constant = 0, var = 0, num = 0, hash = 0, opline_num = 0, jmp_addr = 0x0, zv = 0x0, literal = 0x0, ptr = 0x0}, result = {constant = 0, var = 0, num = 0, hash = 0, opline_num = 0, jmp_addr = 0x0, zv = 0x0, literal = 0x0, ptr = 0x0},
  extended_value = 0, lineno = 0, opcode = 40 '(', op1_type = 1 '\001', op2_type = 0 '\000', result_type = 0 '\000'}(gdb) p op_array->opcodes[2]
$6 = {handler = 0x5555558cd390 <ZEND_RETURN_SPEC_CONST_HANDLER>, op1 = {constant = 4122498152, var = 4122498152, num = 4122498152, hash = 140737315886184, opline_num = 4122498152, jmp_addr = 0x7ffff5b85468, zv = 0x7ffff5b85468, literal = 0x7ffff5b85468,
    ptr = 0x7ffff5b85468}, op2 = {constant = 0, var = 0, num = 0, hash = 0, opline_num = 0, jmp_addr = 0x0, zv = 0x0, literal = 0x0, ptr = 0x0}, result = {constant = 0, var = 0, num = 0, hash = 0, opline_num = 0, jmp_addr = 0x0, zv = 0x0, literal = 0x0, ptr = 0x0},
  extended_value = 0, lineno = 0, opcode = 62 '>', op1_type = 1 '\001', op2_type = 0 '\000', result_type = 0 '\000'}
All three instructions have a lineno of 0.
Looking at vld_dump_op(), it was clear why the ops are not being dumped.

I commented that if-block out. And this was the new output:

Comparing this output to the original, unencoded file:

Interesting. So the encoded sample has an additional JMP instruction at the beginning. Oddly, the JMP goes straight to the return though… that can’t be right. This didn’t make sense, so I created more samples.
Comparing Samples
Let’s look at a basic example with an if…else.
<?php$num = rand(0, 1);
if ($num == 1)
{
    echo "1\n";
}
else
{
    echo "0\n";
}?>
And here is the VLD output.


Very interesting… the encoded sample output has 2 additional instructions, and the JMP is at the beginning again. Also, oddly, if you follow the instructions for the encoded output, it just doesn’t add up. First we jump to instruction 4, and then rand() is called. However, only 1 argument is passed to rand. Instruction 3 is not executed prior to the call to rand. Also you can see that the JMPZ is changed to a JMPZNZ. Either we jump to instruction 11 then instruction 3, which is a SEND_VAL. Or we jump to the ASSIGN instruction. None of it makes sense.
There was a common trend I saw when analyzing sample after sample:
- An initial additional JMP instruction
- Some instructions were completely changed – e.g. JMPZ turned into JMPZNZ
- Control flow via branching did not match the logic for an unencoded dump
These observations led me to believe that there was some obfuscation going on.
Opcode Handlers
Back to the debugger. If you look at the op handlers, something sticks out. For reference, there are a variety of op handlers that know what to do with a specific opcode.
(gdb) p op_array->opcodes[0]
$4 = {handler = 0x7ffff4a09280, op1 = {constant = 4122471032, var = 4122471032, num = 4122471032, hash = 140737315859064, opline_num = 4122471032, jmp_addr = 0x7ffff5b7ea78, zv = 0x7ffff5b7ea78, literal = 0x7ffff5b7ea78, ptr = 0x7ffff5b7ea78}, op2 = {constant = 0,
    var = 0, num = 0, hash = 0, opline_num = 0, jmp_addr = 0x0, zv = 0x0, literal = 0x0, ptr = 0x0}, result = {constant = 0, var = 0, num = 0, hash = 0, opline_num = 0, jmp_addr = 0x0, zv = 0x0, literal = 0x0, ptr = 0x0}, extended_value = 0, lineno = 0, opcode = 42 '*',
  op1_type = 0 '\000', op2_type = 0 '\000', result_type = 0 '\000'}(gdb) p op_array->opcodes[1]
$5 = {handler = 0x5555558dfaa0 <ZEND_ECHO_SPEC_CONST_HANDLER>, op1 = {constant = 4122498112, var = 4122498112, num = 4122498112, hash = 140737315886144, opline_num = 4122498112, jmp_addr = 0x7ffff5b85440, zv = 0x7ffff5b85440, literal = 0x7ffff5b85440,
    ptr = 0x7ffff5b85440}, op2 = {constant = 0, var = 0, num = 0, hash = 0, opline_num = 0, jmp_addr = 0x0, zv = 0x0, literal = 0x0, ptr = 0x0}, result = {constant = 0, var = 0, num = 0, hash = 0, opline_num = 0, jmp_addr = 0x0, zv = 0x0, literal = 0x0, ptr = 0x0},
  extended_value = 0, lineno = 0, opcode = 40 '(', op1_type = 1 '\001', op2_type = 0 '\000', result_type = 0 '\000'}(gdb) p op_array->opcodes[2]
$6 = {handler = 0x5555558cd390 <ZEND_RETURN_SPEC_CONST_HANDLER>, op1 = {constant = 4122498152, var = 4122498152, num = 4122498152, hash = 140737315886184, opline_num = 4122498152, jmp_addr = 0x7ffff5b85468, zv = 0x7ffff5b85468, literal = 0x7ffff5b85468,
    ptr = 0x7ffff5b85468}, op2 = {constant = 0, var = 0, num = 0, hash = 0, opline_num = 0, jmp_addr = 0x0, zv = 0x0, literal = 0x0, ptr = 0x0}, result = {constant = 0, var = 0, num = 0, hash = 0, opline_num = 0, jmp_addr = 0x0, zv = 0x0, literal = 0x0, ptr = 0x0},
  extended_value = 0, lineno = 0, opcode = 62 '>', op1_type = 1 '\001', op2_type = 0 '\000', result_type = 0 '\000'}
Notice in opcode 0 that the handler address is in a different address space than the other two opcode handlers. 0x7ffff4a09280 vs 0x5555558dfaa0 or 0x5555558cd390. Also, opcode 0 doesn’t seem to have a symbol associated with the address. On the other hand, opcodes 1 and 2 have handlers that point to ZEND_ECHO_SPEC_CONST_HANDLER and ZEND_RETURN_SPEC_CONST_HANDLER.
Let’s take a look at the address ranges for loaded libraries:
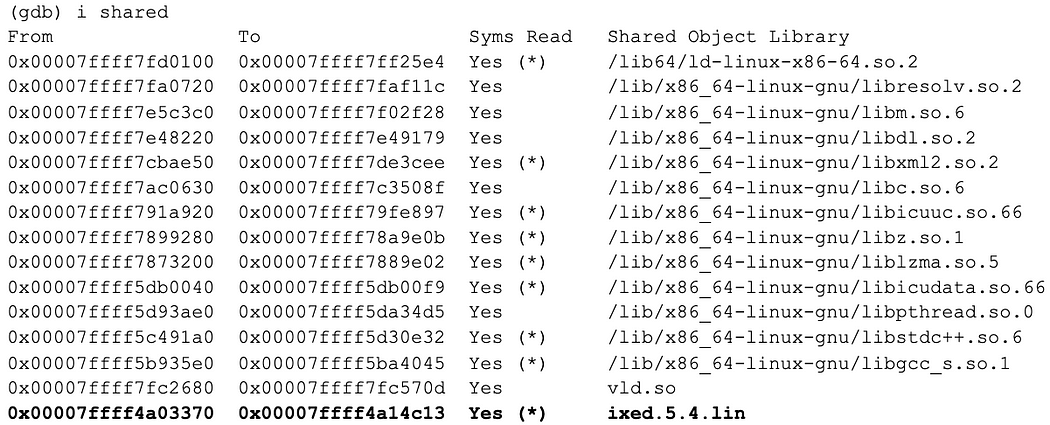
0x7ffff4a09280 belongs to ixed.5.4.lin, which is the SG loader extension.
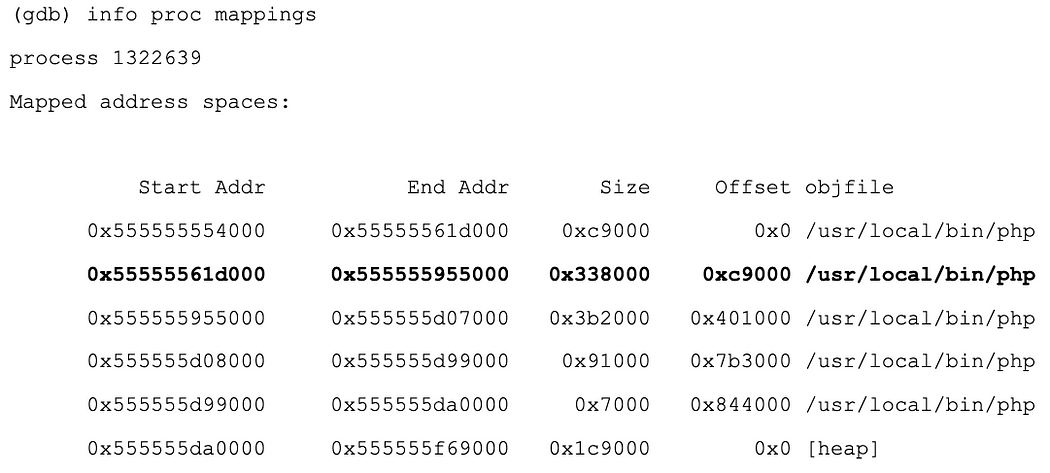
The other two handlers are mapped within the PHP executable. This is quite curious. The first jump instruction handler points to a function contained in the SG loader extension. We’ll set a breakpoint in there and let execution continue.
(gdb) b *0x7ffff4a09280
Breakpoint 2 at 0x7ffff4a09280
(gdb) c
Continuing.

Breakpoint 2, 0x00007ffff4a09280 in ?? () from /usr/local/lib/php/extensions/no-debug-non-zts-20100525/ixed.5.4.lin
I prefer intel over at&t syntax. So we set the flavor.
(gdb) set disassembly-flavor intel
(gdb) disas
No function contains program counter for selected frame.
Weird. Let’s try disassembling a range. No need to read this. More on that later.
(gdb) disas $rip,$rip+128
Dump of assembler code from 0x7ffff4a09280 to 0x7ffff4a09300:
=> 0x00007ffff4a09280: push   rbp
   0x00007ffff4a09281: movabs rsi,0xaaaaaaaaaaaaaaab
   0x00007ffff4a0928b: push   rbx
   0x00007ffff4a0928c: sub    rsp,0x8
   0x00007ffff4a09290: mov    rdx,QWORD PTR [rip+0x210ff9]
   0x00007ffff4a09297: mov    rbx,QWORD PTR [rdi]
   0x00007ffff4a0929a: mov    rax,QWORD PTR [rdi+0x28]
   0x00007ffff4a0929e: movsxd rdx,DWORD PTR [rdx]
   0x00007ffff4a092a1: mov    rbp,QWORD PTR [rbx+0x8]
   0x00007ffff4a092a5: mov    rcx,rbp
   0x00007ffff4a092a8: mov    rdx,QWORD PTR [rax+rdx*8+0xd0]
   0x00007ffff4a092b0: mov    rax,QWORD PTR [rax+0x40]
   0x00007ffff4a092b4: sub    rcx,rax
   0x00007ffff4a092b7: mov    rdx,QWORD PTR [rdx]
   0x00007ffff4a092ba: sar    rcx,0x4
   0x00007ffff4a092be: imul   rcx,rsi
   0x00007ffff4a092c2: shl    rcx,0x4
   0x00007ffff4a092c6: mov    ecx,DWORD PTR [rcx+rdx*1]
   0x00007ffff4a092c9: lea    rcx,[rcx+rcx*2]
   0x00007ffff4a092cd: shl    rcx,0x4
   0x00007ffff4a092d1: lea    rcx,[rax+rcx*1]
   0x00007ffff4a092d5: mov    QWORD PTR [rbx+0x8],rcx
   0x00007ffff4a092d9: mov    rcx,rbx
   0x00007ffff4a092dc: sub    rcx,rax
   0x00007ffff4a092df: mov    rax,rcx
   0x00007ffff4a092e2: sar    rax,0x4
   0x00007ffff4a092e6: imul   rax,rsi
   0x00007ffff4a092ea: shl    rax,0x4
   0x00007ffff4a092ee: call   QWORD PTR [rdx+rax*1+0x8]
   0x00007ffff4a092f2: mov    QWORD PTR [rbx+0x8],rbp
   0x00007ffff4a092f6: add    rsp,0x8
   0x00007ffff4a092fa: pop    rbx
   0x00007ffff4a092fb: pop    rbp
   0x00007ffff4a092fc: ret
I stepped through this, and ultimately landed at the CALL instruction:
0x00007ffff4a092ee: call QWORD PTR [rdx+rax*1+0x8]
Next, I stepped into this function call.
(gdb) si
ZEND_JMP_SPEC_HANDLER (execute_data=0x7ffff5b4c9e0) at php-src/Zend/zend_vm_execute.h:430
430 {
My, oh my. The SG custom JMP handler eventually called the ZEND_JMP_SPEC_HANDLER. There is a zend_execute_data structure passed as an argument as well. After a bit of fumbling around – starting and restarting the debugger – and scratching my head, I noticed something about the data structure passed to the Zend handler.
Operand 1 to the current PHP operation (opline.. which points inside op_array->opcodes), had changed!


The jmp_addr is different! This explains why the control flow logic in the VLD opcode dumps don’t make sense. The JMP operands have been tampered with.
At this point, I felt I needed to do some in depth analysis of the SG jmp handler.
Source Guardian JMP Handler Analysis
I opened ixed.5.4.lin in Hopper Disassembler. The JMP handler function is at offset 0x9280 in the file, and a cursory glance around revealed that there are 4 additional functions composed of similar logic. The usage of constant 0xaaaaaaaaaaaaaaab in each of them was a dead giveaway.
I then realized that these were probably additional custom opcode handlers, and I would need to analyze each of them. My next task was to figure out which opcodes map up to which handlers. I did this by modifying the vld_dump_op() function to compare the current opcode structure’s handler address to the handler supplied by the Zend engine. If the handler’s address didn’t match up with the Zend handler’s address, it would print some output prior to dumping the operation’s fields.

This allowed me to determine some of the offsets of custom handlers and their corresponding opcodes. For example, here is a JMPZNZ:

and a JMP:

These offsets (0x280 and 0x3f0) correspond to the handlers in the Hopper disassembly. This was confirmation that the nearby functions were almost all surely custom handlers.
At this point I knew I had to accomplish a couple things:
- Map all custom handler functions to opcode values in the SG loader extension
- Figure out how to “fix” the opcode structures so that vld_dump_op() would display the correct operands. This would make the control flow logic make sense.
I decided to go with option 2 first. I wanted to prove that I could doctor up a basic JMP instruction before I moved on to other instructions. I’m going to run through the JMP handler, and we’ll talk about what’s happening. Once we’ve gone through this handler, the others are quite similar.
Dynamic Analysis of the JMP Handler
As we’ve seen, a JMP is placed at the beginning of each op_array. At the second invocation of execute(), we can print the first opcode to get the address of the JMP handler. It should look familiar.
(gdb) p op_array->opcodes[0]
$1 = {handler = 0x7ffff4a09280, op1 = {constant = 4122470936, var = 4122470936, num = 4122470936, hash = 140737315858968, opline_num = 4122470936, jmp_addr = 0x7ffff5b7ea18, zv = 0x7ffff5b7ea18, literal = 0x7ffff5b7ea18,
    ptr = 0x7ffff5b7ea18}, op2 = {constant = 0, var = 0, num = 0, hash = 0, opline_num = 0, jmp_addr = 0x0, zv = 0x0, literal = 0x0, ptr = 0x0}, result = {constant = 0, var = 0, num = 0, hash = 0, opline_num = 0, jmp_addr = 0x0,
    zv = 0x0, literal = 0x0, ptr = 0x0}, extended_value = 0, lineno = 0, opcode = 42 '*', op1_type = 0 '\000', op2_type = 0 '\000', result_type = 0 '\000'}
(gdb) b *0x7ffff4a09280
Breakpoint 2 at 0x7ffff4a09280
Next, we’ll continue into the handler function.
(gdb) c
Continuing.
Breakpoint 2, 0x00007ffff4a09280 in ?? () from /usr/local/lib/php/extensions/no-debug-non-zts-20100525/ixed.5.4.lin
Next, I dumped the registers to see what’s pointing where. My research was conducted on an x86_64 architecture – System V. This is important to know for recognizing function arguments.
(gdb) info registers
rax            0x7ffff5b7ea18      140737315858968
rbx            0x7ffff5b4c9e0      140737315654112
rcx            0x7ffff5b4ca70      140737315654256
rdx            0x555555dbaa68      93825001040488
rsi            0x0                 0
rdi            0x7ffff5b4c9e0      140737315654112
rbp            0x7ffff5b809f8      0x7ffff5b809f8
rsp            0x7fffffff93a8      0x7fffffff93a8
r8             0x555555f53ec0      93825002716864
r9             0x7ffff5b85770      140737315886960
r10            0xfffffffffffff6bf  -2369
r11            0x55555594a9b0      93824996387248
r12            0x1                 1
r13            0x3ff0              16368
r14            0x7ffff5b4ca70      140737315654256
r15            0x0                 0
rip            0x7ffff4a09280      0x7ffff4a09280
eflags         0x246               [ PF ZF IF ]
cs             0x33                51
ss             0x2b                43
ds             0x0                 0
es             0x0                 0
fs             0x0                 0
gs             0x0                 0
So the rdi register is pointing to 0x7ffff5b4c9e0. This is the first function argument for System V calling convention. If you look at zend_vm_execute.h, you’ll see that a handler takes an argument of type ZEND_OPCODE_HANDLER_ARGS.
static int ZEND_FASTCALL ZEND_JMP_SPEC_HANDLER(ZEND_OPCODE_HANDLER_ARGS)
Really, it’s just a macro for a pointer to a zend_execute_data structure.
#define ZEND_OPCODE_HANDLER_ARGS zend_execute_data *execute_data TSRMLS_DC
Let’s print out the structure contents in GDB.
(gdb) p *((zend_execute_data *)0x7ffff5b4c9e0)$4 = {opline = 0x7ffff5b7ea18, function_state = {function = 0x7ffff5b809f8, arguments = 0x0}, fbc = 0x0, called_scope = 0x0, op_array = 0x7ffff5b809f8, object = 0x0, Ts = 0x7ffff5b4ca70, CVs = 0x7ffff5b4ca70,symbol_table = 0x555555dbaa68 <executor_globals+392>, prev_execute_data = 0x7ffff5b4b060, old_error_reporting = 0x0, nested = 0 '\000', original_return_value = 0x7ffff5b4c438, current_scope = 0x7ffff5b4c458,current_called_scope = 0x7ffff5b4c478, current_this = 0x7ffff5b4c498, current_object = 0x7ffff5b4c4b8}This makes sense because the op_array has the same address as the argument to execute(). Here’s a look back at when we hit that break point.
Breakpoint 1, execute (op_array=0x7ffff5b809f8) at php-src/Zend/zend_vm_execute.h:343
Now that we know the argument is zend_execute_data, allow me to show you the important functionality in the function. For reference, here is the disassembly again:
   0x00007ffff4a09280: push   rbp
   0x00007ffff4a09281: movabs rsi,0xaaaaaaaaaaaaaaab
   0x00007ffff4a0928b: push   rbx
   0x00007ffff4a0928c: sub    rsp,0x8
   0x00007ffff4a09290: mov    rdx,QWORD PTR [rip+0x210ff9]
   0x00007ffff4a09297: mov    rbx,QWORD PTR [rdi]
   0x00007ffff4a0929a: mov    rax,QWORD PTR [rdi+0x28]
   0x00007ffff4a0929e: movsxd rdx,DWORD PTR [rdx]
   0x00007ffff4a092a1: mov    rbp,QWORD PTR [rbx+0x8]
   0x00007ffff4a092a5: mov    rcx,rbp
   0x00007ffff4a092a8: mov    rdx,QWORD PTR [rax+rdx*8+0xd0]
   0x00007ffff4a092b0: mov    rax,QWORD PTR [rax+0x40]
   0x00007ffff4a092b4: sub    rcx,rax
   0x00007ffff4a092b7: mov    rdx,QWORD PTR [rdx]
   0x00007ffff4a092ba: sar    rcx,0x4
   0x00007ffff4a092be: imul   rcx,rsi
   0x00007ffff4a092c2: shl    rcx,0x4
   0x00007ffff4a092c6: mov    ecx,DWORD PTR [rcx+rdx*1]
   0x00007ffff4a092c9: lea    rcx,[rcx+rcx*2]
   0x00007ffff4a092cd: shl    rcx,0x4
   0x00007ffff4a092d1: lea    rcx,[rax+rcx*1]
   0x00007ffff4a092d5: mov    QWORD PTR [rbx+0x8],rcx
   0x00007ffff4a092d9: mov    rcx,rbx
   0x00007ffff4a092dc: sub    rcx,rax
   0x00007ffff4a092df: mov    rax,rcx
   0x00007ffff4a092e2: sar    rax,0x4
   0x00007ffff4a092e6: imul   rax,rsi
   0x00007ffff4a092ea: shl    rax,0x4
   0x00007ffff4a092ee: call   QWORD PTR [rdx+rax*1+0x8]
   0x00007ffff4a092f2: mov    QWORD PTR [rbx+0x8],rbp
   0x00007ffff4a092f6: add    rsp,0x8
   0x00007ffff4a092fa: pop    rbx
   0x00007ffff4a092fb: pop    rbp
   0x00007ffff4a092fc: ret
The Important Parts
0x00007ffff4a09290: mov rdx,QWORD PTR [rip+0x210ff9]
What happens is a pointer is dereferenced and the value is stored into rdx. Notice that the pointer address is calculated as a relative offset from the instruction pointer, rip.
(gdb) p/x $rdx
$1 = 0x7ffff4c1a640
And it points into the SG loader … so it’s dipping into the loader to grab another pointer.
(gdb) info proc mappings
...0x7ffff4c1a000     0x7ffff4c1b000     0x1000    0x1a000 ixed.5.4.lin...
Prior to this instruction:
0x00007ffff4a092d5: mov QWORD PTR [rbx+0x8],rcx
Rbx points to opline (current operation), so this means the instruction sets opline->op1 to the value at rcx.
(gdb) p *(zend_op *)$rbx
$35 = {handler = 0x7ffff4a09280, op1 = {constant = 4122470936, var = 4122470936, num = 4122470936, hash = 140737315858968, opline_num = 4122470936, jmp_addr = 0x7ffff5b7ea18, zv = 0x7ffff5b7ea18, literal = 0x7ffff5b7ea18,
ptr = 0x7ffff5b7ea18}, op2 = {constant = 0, var = 0, num = 0, hash = 0, opline_num = 0, jmp_addr = 0x0, zv = 0x0, literal = 0x0, ptr = 0x0}, result = {constant = 0, var = 0, num = 0, hash = 0, opline_num = 0, jmp_addr = 0x0,
zv = 0x0, literal = 0x0, ptr = 0x0}, extended_value = 0, lineno = 0, opcode = 42 '*', op1_type = 0 '\000', op2_type = 0 '\000', result_type = 0 '\000'}
After the instruction executes, notice that op1 has changed, and the jmp_addr is a different address.
(gdb) p *(zend_op *)$rbx
$39 = {handler = 0x7ffff4a09280, op1 = {constant = 4122470984, var = 4122470984, num = 4122470984, hash = 140737315859016, opline_num = 4122470984, jmp_addr = 0x7ffff5b7ea48, zv = 0x7ffff5b7ea48, literal = 0x7ffff5b7ea48,
ptr = 0x7ffff5b7ea48}, op2 = {constant = 0, var = 0, num = 0, hash = 0, opline_num = 0, jmp_addr = 0x0, zv = 0x0, literal = 0x0, ptr = 0x0}, result = {constant = 0, var = 0, num = 0, hash = 0, opline_num = 0, jmp_addr = 0x0,
zv = 0x0, literal = 0x0, ptr = 0x0}, extended_value = 0, lineno = 0, opcode = 42 '*', op1_type = 0 '\000', op2_type = 0 '\000', result_type = 0 '\000'}
At the point when the zend vm opcode handler is called, the operands have been de-obfuscated. The actual JMP handler is called, and control flow can occur as it was originally intended to work.
0x00007ffff4a092ee: call QWORD PTR [rdx+rax*1+0x8]
Finally, the opline->op1 is restored back to its obfuscated value before the function returns.
0x00007ffff4a092f2: mov QWORD PTR [rbx+0x8],rbp
So basically,
- The current op is de-obfuscated with its original operands.
- Then the zend vm opcode handler is called.
- And finally, the op is restored back into an obfuscated state.
My strategy
Now that we’ve seen how the most basic SG opcode handler (JMP) is implemented, I’d like to talk about my process for “fixing” the zend_op structures prior to dumping them with vld_dump_op(). Remember that the control flow logic doesn’t add up as of now. It took me a while to figure out a solid strategy for this.
What I ended up doing was creating functions matching up to each of the SG handlers. I copied all of the assembly instructions, and modified the functions slightly. The modifications include the following:
- construct a zend_execute_data object and pass it in as argument 1 (rdi)
- dynamically calculate the address for this: mov rdx,QWORD PTR [rip+0x210ff9] … and pass it in as argument 2 (rsi)
- instead of calling the zend vm handler, store that address as the handler in the opline (current instruction). This would cause the zend vm handler to be called instead of the SG handler.
- don’t restore the operands! they’ve already been modified to reflect the correct ones. e.g. jmp destination will make sense
Here is my function for fixing JMP operations. The instructions I’ve added or edited are bold:
fix_jmp:
mov rdx, QWORD PTR [rsi] # set rdx to point to some structure containing other pointers
push rbp
movabs rsi, 0xaaaaaaaaaaaaaaab
push rbx
sub rsp, 0x8
mov rbx, qword ptr [rdi] # rdi points to opline
mov rax, qword ptr [rdi+0x28]
movsxd rdx, dword ptr [rdx]
mov rbp, qword ptr [rbx+8]
mov rcx, rbp
mov rdx, qword ptr [rax+rdx*8+0xd0]
mov rax, qword ptr [rax+0x40]
sub rcx, rax
mov rdx, qword ptr [rdx]
sar rcx, 0x4
imul rcx, rsi
shl rcx, 0x4
mov ecx, dword ptr [rcx+rdx]
lea rcx, qword ptr [rcx+rcx*2]
shl rcx, 0x4
lea rcx, qword ptr [rax+rcx]
mov qword ptr [rbx+8], rcx
mov rcx, rbx
sub rcx, rax
mov rax, rcx
sar rax, 0x4
imul rax, rsi
shl rax, 0x4
# originally this would call ZEND_SPEC_JMP_HANDLER
# but now, we'll just set the opline->handler to the real one
mov rcx, qword PTR [rdx+rax+8]
mov qword PTR [rbx], rcx# removed
# this would reset op1 values to original "obfuscated" values
# mov qword [rbx+8], rbp
add rsp, 0x8
pop rbx
pop rbp
ret
This process was repeated for all of the custom operation handlers. A new function was created to fix various instruction types.
Once I was able to fix all instruction types that SG seemed to have mangled, there was one final (or two, really) hurdle to jump over. The problem was that, since I was hooking zend_execute, I was only dumping opcodes that were actually being executed. So for example, the “main” part of a PHP file would be dumped because it was the logic that had to run. But as we’ll see, this leaves out some key components.
Functions and Classes
Any functions that were defined but were never executed would not be dumped. This was true for classes and their methods as well.
We’ll look at an example with classes, since it tests both.
<?phpclass ClassOne
{
    function func_one()
    {
        echo "one";
    }function notused_one()
    {
        return 1;
    }
}class ClassTwo
{
    function func_two()
    {
        echo "two";
    }function notused_two()
    {
        return 2;
    }
}$a = rand(1, 2);if ($a == 1)
{
    $b = new ClassOne();
    $b->func_one();
}else
{
    $b = new ClassTwo();
    $b->func_two();
}?>
There are two classes, each with a method that could be used and a “notused” method that will absolutely not be called. Depending on whether rand() returns a 1 or 2, either ClassOne->func_one() or ClassTwo->func_two() will be executed. The output will indicate which method was called.
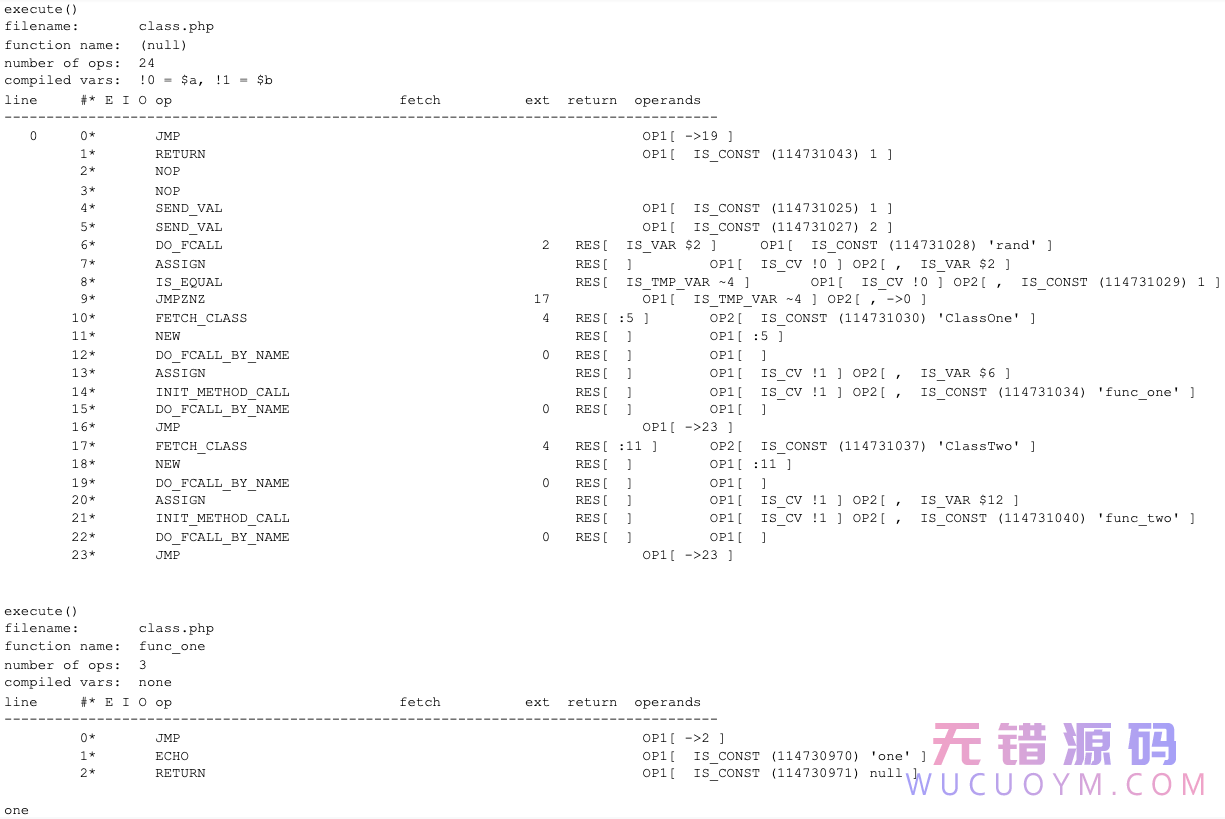
As you can see in this output, ClassOne->func_one() was called. The main logic of the script is dumped along with func_one(). However, notused_one() is missing from the output as well as all of ClassTwo’s methods.
The key to dumping the unused classes and functions is to access the compiler globals function table and class table. The only trick is that these tables need to be “fixed” prior to dumping, just like we’ve done before. Every function entry is a zend_op_array, so we can apply the same “fixing” logic to functions and class methods.
Wrapping Up
All in all, the main opcode dumping logic, handled in vld_execute, looks like the below snippet. First the main op_array is dumped. After this, any functions are dumped that exist in the function_table, and finally, the class_table is searched for methods, and these methods are dumped as well.
// first, fix opcodes not contained in a function or class
if (op_array->function_name == NULL || strlen(op_array->function_name) == 0) {
 fix_op_array(op_array);
 vld_dump_oparray (op_array TSRMLS_CC);
}// now fix defined functions
zend_hash_apply(CG(function_table), (apply_func_t) vld_fix_fe TSRMLS_CC);
zend_hash_apply_with_arguments (CG(function_table) APPLY_TSRMLS_CC, (apply_func_args_t) vld_dump_fe, 0);// now fix defined classes and class funcs
zend_hash_apply (CG(class_table), (apply_func_t) vld_fix_cle TSRMLS_CC);
zend_hash_apply (CG(class_table), (apply_func_t) vld_dump_cle TSRMLS_CC);
The “fix_op_array” function is responsible for “fixing” all of the op_arrays, and it is used inside vld_fix_fe as well. This function performs several tasks including calculating offsets within the SG loader extension, determining which opcodes to fix, and ultimately, calling the functions that were implemented to “fix” the op_arrays. Here is a switch case showing the opcode numbers that are handled. Notice that several opcodes can map to the same fix function.
switch (execute_data->op_array->opcodes[i].opcode)
  {
   // 42
   case ZEND_JMP:
   // 100
   case ZEND_GOTO:
    fix_jmp(execute_data, sg_offset);
    break;
   // 46
   case ZEND_JMPZ_EX:
   // 47
   case ZEND_JMPNZ_EX:
   // 152
   case ZEND_JMP_SET:
   // 158
   case ZEND_JMP_SET_VAR:
    fix_jmpnz_ex(execute_data, sg_offset);
    break;
   // 45
   case ZEND_JMPZNZ:
    fix_jmpznz(execute_data, sg_offset);
    break;
   // 68
   case ZEND_NEW:
   // 78
   case ZEND_FE_FETCH:
   // 77
   case ZEND_FE_RESET:
    fix_new(execute_data, sg_offset);
    break;
   // 107
   case ZEND_CATCH:
    fix_catch(execute_data, sg_offset);
    break;
   default:
    break;
  }
If you’re interested in viewing all of the code, take a look at the project on GitHub. The “fix” functions are all defined in fix_sg.S. Keep in mind that this is all tailored to the SG 5.4 Linux x86_64 loader extension. Additionally, to limit the length of output, I’ve coded things up so that no includes will be dumped.
Before you leave, let’s see a fully decoded class.php. I’ve had to split the output up into multiple images due to the size.
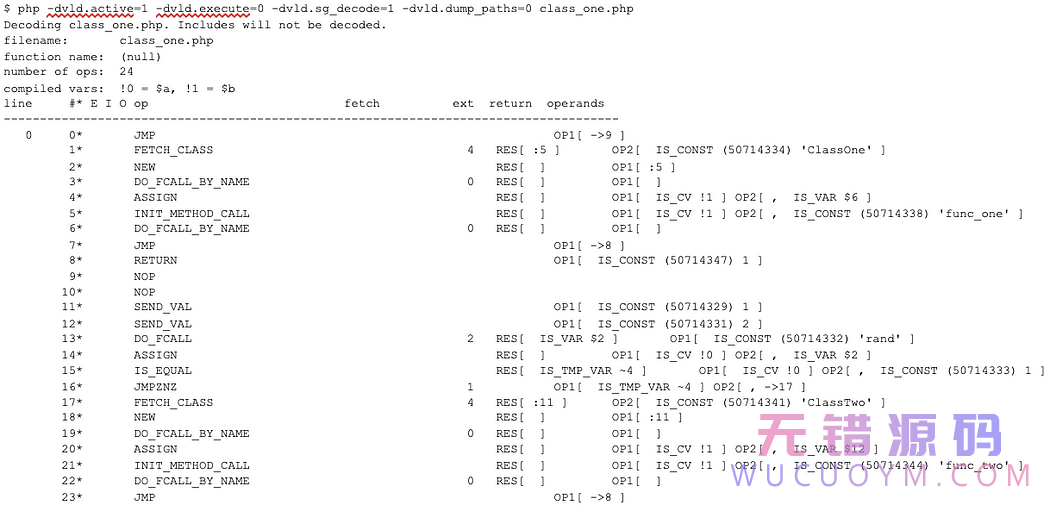
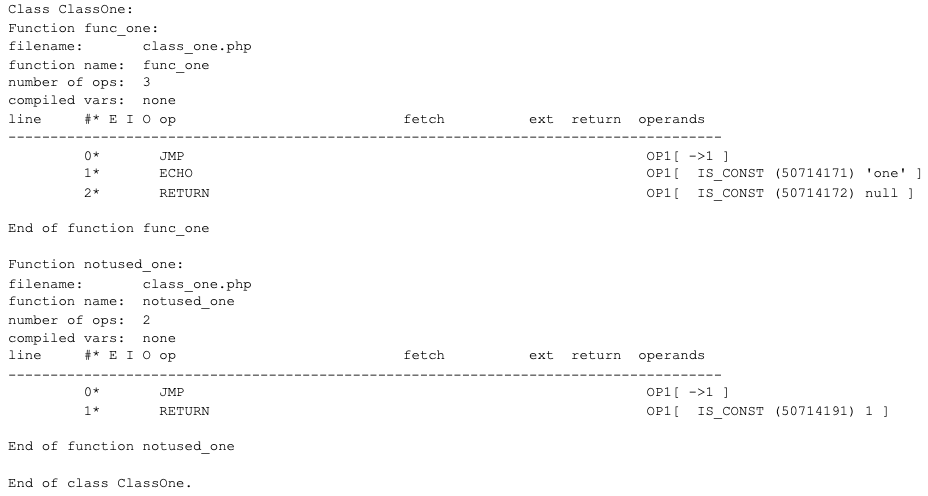
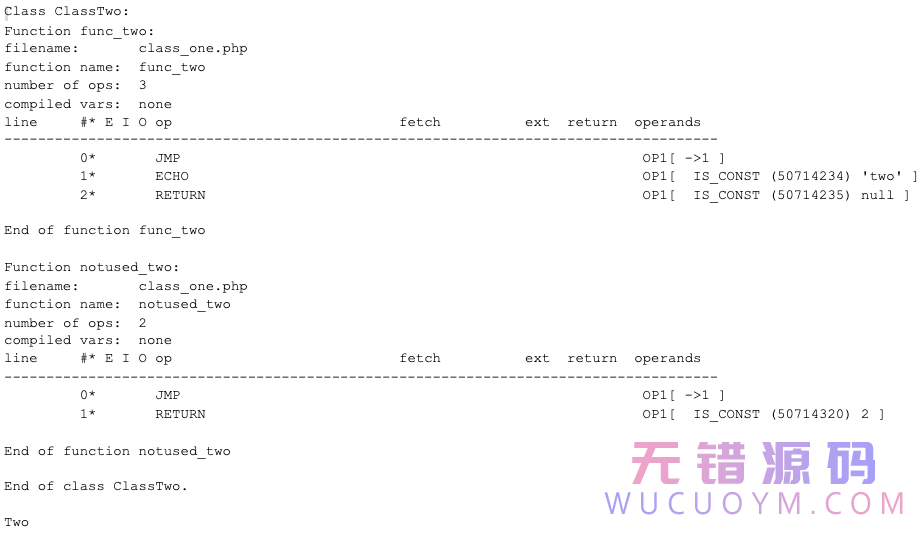
There you have it. By hooking zend_execute() and fixing opcodes using SourceGuardian’s own decoder logic, we can dump an encoded file with VLD’s functionality. As I said before, the decoder was implemented to target encoded PHP 5.4 files on an x86_64 Linux environment. If you find any bugs or see improvement opportunities, please feel free to reach out
